top of page
Home
About
Services Page
Portfolio Page
Data Visualization
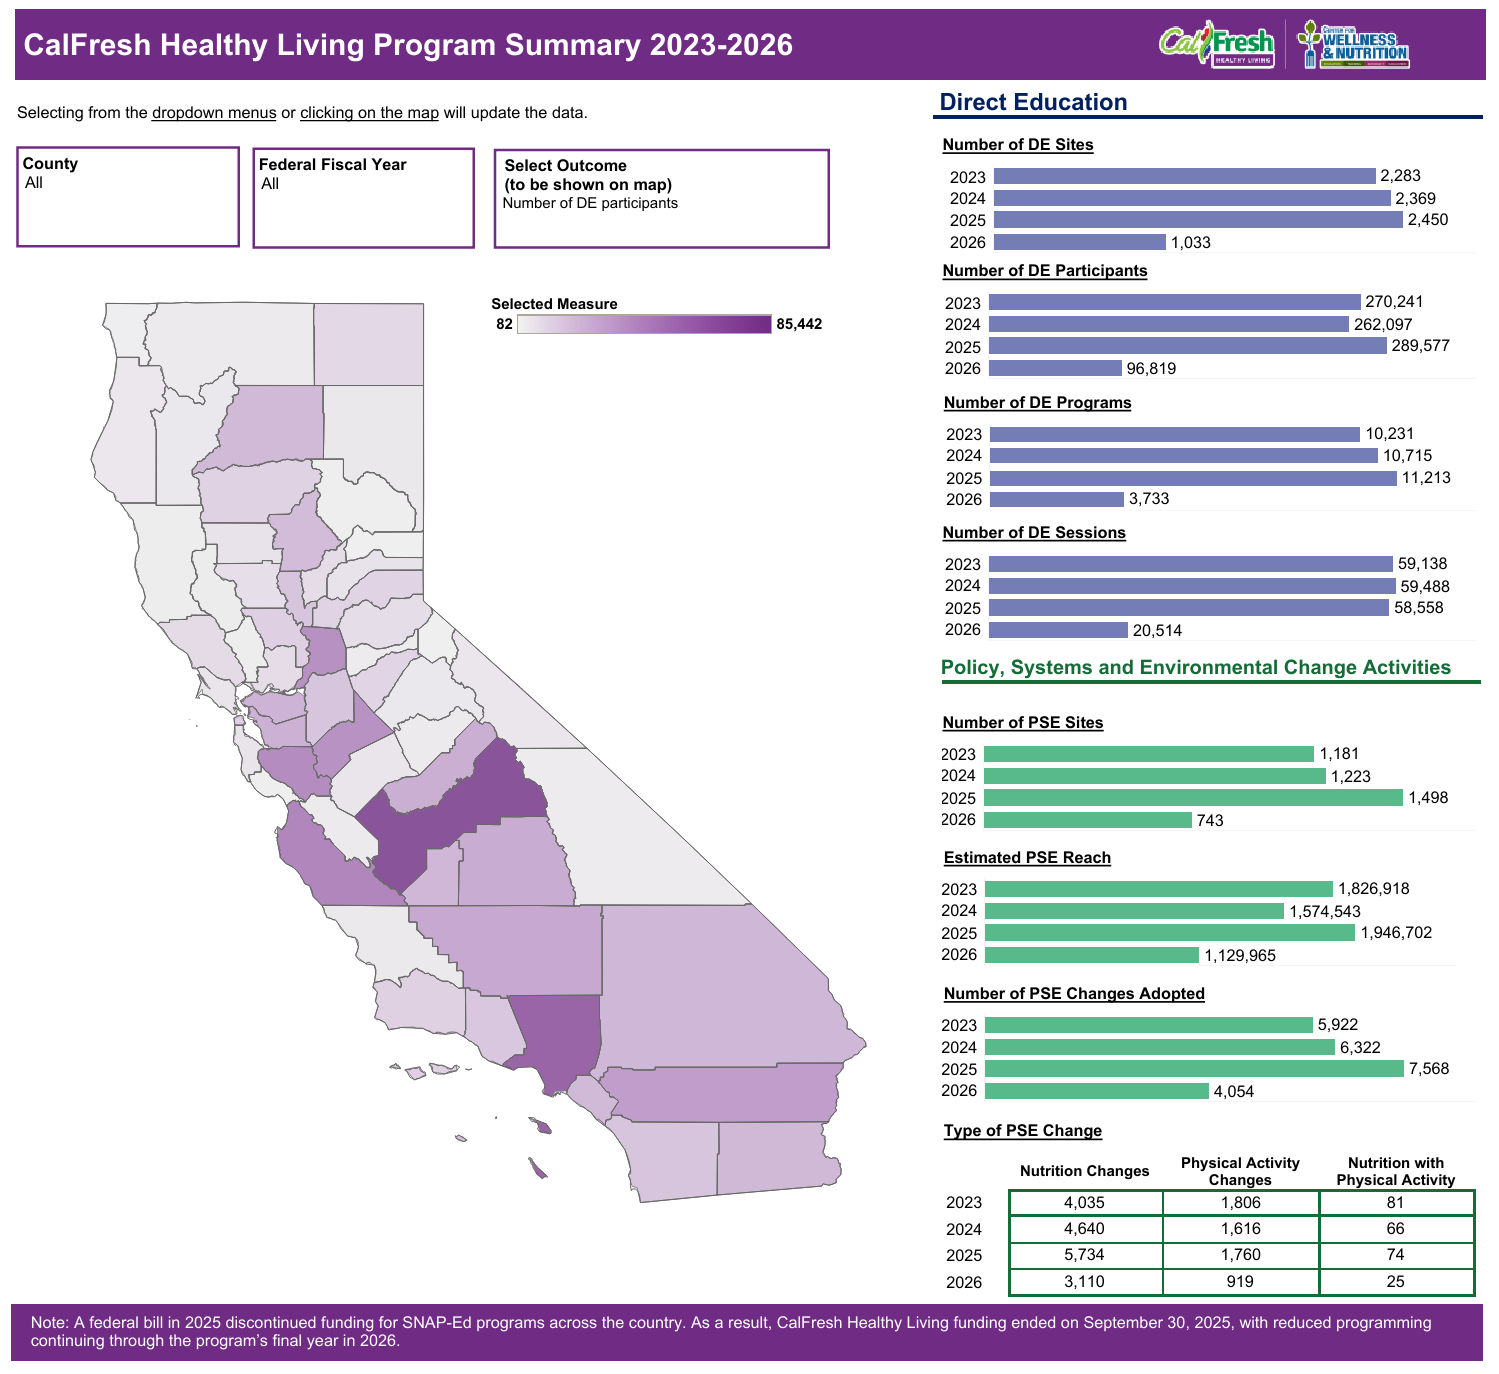
Interactive dashboards and visual reports that turn complex program data into insight at a glance — designed to support decision-making, not just satisfy a reporting requirement.
Link
CFHL 2023 - 2026
Link
NC SNAP-Ed 2023-2025
01
Data Visualization
Previous
01
Next
01 / 01
Close
Previous
Next
01
Previous: Program Evaluation Reports and Summaries
Next: Conference Presentations
bottom of page